Figure 1
A typical graph of natural radiation contribution. From the NCRP 93 report (1987).
*Natural Background Gamma Radiation*
What to expect for a zero reading
By: Radiological71
26 April, 2008
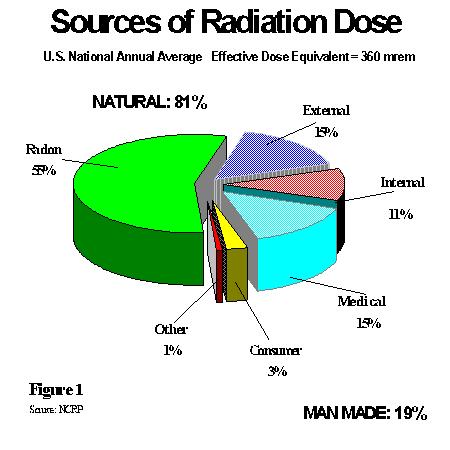
Background radiation comes from many sources. The usual pie graph as supplied for radiation safety (figure 1) shows medical x-rays, Radon and cosmic rays as the usual suspects. Radon is a decay product of the Uranium series, and decays by emitting an alpha particle. The direct parent of Radon is Radium, which emits gamma and alpha particles. Radon gas has different levels of concentration in buildings and can vary considerably.
Figure 1
A typical graph of natural radiation contribution. From the NCRP 93 report (1987).
From figure 1, most of the radiation dose is listed as coming from Radon. Radon is a radioactive gas, and decays by producing alpha particles, which are short ranged and can be stopped my very thin thicknesses of skin, paper or whatever. Because of this, many radiation detectors will not detect any dose from alpha particles, since the walls of the detector are too thick for alpha particles to travel through. The background radiation as measured by most thick walled detectors will be the natural background gamma radiation.
So, if a radiation detector has walls that are too thick to detect alpha particles, the dose measured is coming from the background gamma radiation. (Neutron and beta radiation are pretty uncommon and can be neglected here). A natural question is then: what is a reasonable value for the background gamma count?
The units used here are Grays (Gy, 1Gy = 1 J/Kg) and the rem (a hundredth of a Gray for gamma rays). A nano Gray is 10-9 Gray or a thousandth of a micro Gray, which corresponds to 0.1 micro rem.
Values from around the world
Various sources relate the integrated gamma ray radiation dose for a year. [Uyttenhove 2004] produced some results in units of activity (counts of radiation) per square meter in Belgium. In Canada [Grasty 2004], the annual background gamma radiation was determined to be 219 micro Gray (21.9 milli rem). The United Nations Scientific Committee on the Effects of Atomic Radiation (UNSCEAR) report of 2000 is summarized in [Charles 2001]. The estimation of total annual terrestrial gamma rays and cosmic rays is 0.9 mGy (90 milli rem).
A chart of the average dose rate form [UNSCEAR 2000] is shown is figure 2.
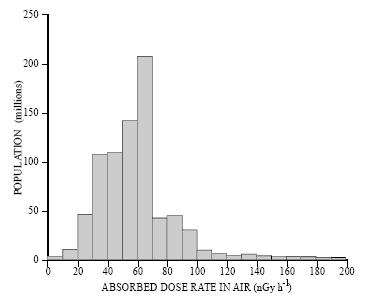
Figure 2
Average background dose rates as measured in 25 countries in the UNSCEAR report 2000. Most people are subjected to around 60 nGy per hour of radiation.
Some measurements in Michigan, Colorado and Minnesota from 1969 [Levins 1969] report the background gamma rates of 6.6 to 14.5 micro rem per hour using a scintillation detector. Tanzania [Banzi 2002] measured background gamma values of 100 nGy per hour (0.01 milli rem per hour). Taiwan [Lin 1996] reported an indoor gamma dose rate of 72 nGy per hour (7.2 micro rem). Istanbul [Karahan 2000] reported a background gamma rate of 65 nGy per hour (6.5 micro rem).
In Argentina, Velasco [Velasco 2007] relates a background gamma of 76 +/- 30 nGy per hour (7.6 micro rem). In Tokyo, a measurement of 246 houses yielded a gamma dose rate of 53 nGy per hour (5.3 micro rem) [Saito 1997]. Beside the Waste Isolation Pilot Plant (WIPP) in Germany, a value of 34 nGy per hour (34 micro rem per hour) was measured. Other sources [Eisenbud 1997] give similar values of 5 to 9 nGy per hour gamma ray dose around the New York state area.
Looking at a Survey meter
Generally then, in most normal locations around the world, the background gamma rate is less than 100 nGy per or hour 10 micro rem per hour. This is 0.01 milli rem per hour, so on a survey meter with a “x0.1” scale, this corresponds to a reading just to the start of the dial indicator. Shown in figures 3 and 4 are the indicators of two typical radiation meters. An old Victoreen 493 (which doesn't have a x 0.1 setting) and a Ludlum 14C which has a x 0.1 setting.
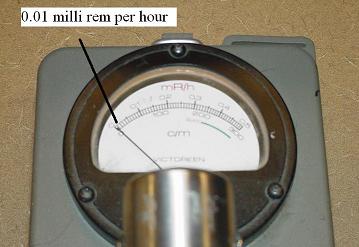 | 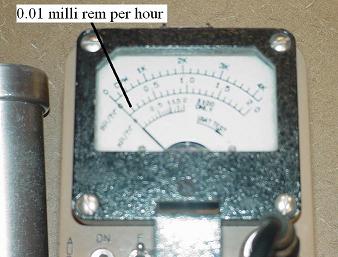 | |
In the cases from around the world, in “normal” areas, the dose rates were less than 100 nano Grays per hour (0.01 milli rem). If 50 nGy per hour (0.005 milli rem) is a reasonable low side for the background, most detectors will be incapable of reading any accurate background gamma count, or at best tiny fluctuations of the meter. In passing, both meters that I have used recently (a Victoreen 450p and a Ludlum 14C the calibrations have been off by around 100% at the background level, and 20% at the high dose rads per hour) level.
Summary
A typical gamma radiation contribution to background radiation is less than 100 nano Gray per hour (0.01 millirem per hour). For both of the meters displayed here, that corresponds to a barely detectable value.
References
Online:
Activity in Belgium:
[Uyttenhove 2004]
Measurement of natural gamma radiation in Belgium by means of high resolution in-situ spectrometry.
Activity in Canada:
[RL Grasty 2004]
Annual Effective dose from natural sources of ionizing radiation in Canada, Radiation Protection and Dosimetry 108 (3) pages 215-226 2004
Activity in Tanzania:
[Banzi 2002]
A survey of background radioactivity and dose rates in Tanzania Health Physics 82(1) pages 80-86 2002
University of Michigan health Physics Society
Background Measurements in Michigan, Colorado and Minnesota. Extensive data from 1969:
[Levin 1969]
Natural background Gamma Radiation Dose rate measurements in Michigan, Colorado and Minnesota American Journal of Public Health 59(1) pages 102-109 1969
UNSCEAR report summary:
[Charles 2001]
UNSCEAR Report 2000: Sources and effects of ionizing radiation. Journal of Radiation protection (21) pages 83-85 2001.
UNSCEAR Report:
[UNSCEAR 2000]
UNSCEAR Report 2000 Report the general assembly
[Lin 1996]
Yu-Ming Lin natural background radiation dose assessment in Tiawan. The Natural Radiation Environment 22 S1 Pages 45-48. 1996.
[Karahan 2000]
G. Karahan Journal of Environmental Radioactivity 47 (2) Pages 213-221 January 2000
[Velasco 2007]
H Velasco Contribution to the external gamma radiation dose rate from 137Cs and 40K activity concentrations determined in the vertical profile of sandy beaches. Journal of Radioanalytical and Nuclear Chemistry Volume 273 (2) pages 395-399 2007
WIPP (Trans-Uranium waste storage facility background)
[Chiou 2004]
Creating a baseline radiological standard for the waste isolation pilot plant underground 2004 Isotopes in Environmental Health Studies 490(3) pages213-220 2004, proceedings of the 26th Annual Meeting of the German Association for Stable Isotope Research (GASIR) October, 6 to 8, 2003, Cologne, Germany
[Saito 1997]
K. Saito Measurements of Gamma Dose rates in Dwellings in the Tokyo metropolitan area Radiation Protection and Dosimetry 69 pages 61-67 1997
Offline:
[Eisenbud 1997]
M. Eisenbud Environmental Radioactivity fourth edition, TD196.RE597 ISBN 0-12-235154-1Academic Press 1997
Radiological71
www.alpharubicon.com
All materials at this site not otherwise credited are Copyright © 1996 - 2008 Trip Williams. All rights reserved. May be reproduced for personal use only. Use of any material contained herein is subject to stated terms or written permission.