*Radiation Protection Calculations*
For most of us, the idea of a nuclear attack is a scary thought. We understand the basics of what we need to do when it occurs, such as find protection from the fallout (radiation), stay in the protection until the outside levels are safe, etc. However, when you begin to look carefully at these tasks, the details can quickly become overwhelming.
For example, the amount of protection provided by a shelter is directly related to how much material, or more specifically how much mass, is between you and the source of the radiation. Most of us also know that different materials protect at different levels. However, when you sit down with a pencil and paper to calculate the "protection level" of your shelter, the math can quickly get intimidating for all but the most dedicated engineers.
I have been in this same position. In planning a shelter I asked myself a few questions:
1. How much protection do I need?
2. What is the "Protection Factor" of a shelter? And how much is enough?
3. What materials can I use to protect my family and how much do I need to do the job?
4. How long should I stay in my shelter before it is safe to come out?
Well, as I began working through some of these questions, I found myself writing, erasing, and writing some more as I worked through dozens of calculations. Then it dawned on me, I have the computer tools necessary to make many of these calculations in a few seconds so I can spend more time on results.
The attached spreadsheet is the result of my efforts to date. I submit it to the group for use (and review).
Radiation Protection Spreadsheet in XLS Format (A New Window will Open)
I am not a nuclear engineer by training. What is included in the attached file is what I have learned and copied from others. I have attempted to provide sources of my data whenever possible so you could recreate or check my data for yourself. I have also leaned toward the most conservative numbers I could find whenever possible.
For example, if two authors quoted the half-value thicknesses for steel at 1.0 inches and 1.2 inches respectively, I used the thicker amount (1.2 inches). My thoughts were that I would rather have a little extra protection than necessary rather than just enough, or not quite enough. So, for most of the specific numbers/amounts quoted in the spreadsheet, you can probably find documented contradicting values from a different source. So, if you have always heard that 36 inches of packed earth would sufficiently protect you from all radiation, and yet the spreadsheet doesn’t bear that out, please feel free to check the sources and recheck my calculations. By the way, all these numbers can be changed by you on the "configure" tab of the spreadsheet… but I’m getting a little ahead of myself.
General Information About the Spreadsheet
Spreadsheet Limitations/Disclaimer. This spreadsheet uses commonly recognized formulas, such as the 7/10 rule, to estimate the amount of radiation that might be expected. One of the biggest limitations however is that these formula assume that the nuclear material was completely fissioned (or fusioned) in a nuclear detonation. Therefore, these formula and results DO NOT APPLY TO DIRTY BOMBS where radioactive material is simply dispersed with little or no attempt to detonate it.
Software Version. In order to open and use this spreadsheet, you will need a copy of Microsoft Excel, which installs as part of Microsoft Office. This spreadsheet was created using Microsoft Excel 2000. I don't have an older version of Excel to know if it is "retro" to earlier versions. If it isn't please let me know and I'll try to find a way to convert it.
Enable Macros - Yes. When you open the file, it will ask if you want to 'Enable Macros'. Please answer 'Yes'. The macros contained in the file allow you to use some buttons which make navigation a little easier.
User Input Cells (yellow background). In order to make entering information as natural as possible, I have highlighted the primary data input cells with a yellow background. If you point to these cells for a second, you should see a "comment" pop-up appear to explain what information should be provided.
Protected Cells. This spreadsheet is protected by a password. Only the yellow data entry cells will accept input while protected. I did not do this in order to "hide" anything, I simply protected it to ensure an accidental keystroke didn’t delete a critical formula. The password is provided on the "config" tab. Please feel free to unprotect the sheet, look under the hood and make whatever changes you wish. (See Feedback/Comments below)
Feedback/Comments. Please feel free to comment on anything and everything. Have I included enough information for the results to make sense? Is it in a logical format? Do I need additional calculations? I want to make this a tool everyone can use in an emergency so no comment or feedback will offend me. Feel free to poke around and challenge me on my math if necessary as well.
Spreadsheet Explanation (Tab by Tab)
Below is a summary of what is included in the spreadsheet on each tab. There is a lot of information in a small space and it is easy to get information overload at first glance. Don’t worry, most of the critical features are on the very first tab, the rest is just supporting information or additional features.
This spreadsheet is made up of twelve (12) tabs.
1. Protection vs Radiation Hazards tab
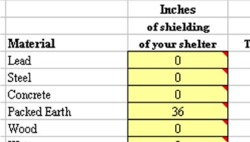
First, input the material thicknesses of various shielding material of your current (or planned) shelter. Please use INCHES. So, if you have four (4) inches of brick, put a "4" in the yellow cell next to "Brick, common clay". Then, if you have one inch of sheetrock (wallboard), put a "1" in the yellow cell next to "Wallboard/Gypsum". Feel free to mix and match the materials because the spreadsheet will use whatever amounts for each material you provide to calculate the protection factor.
The spreadsheet will then take those numbers, using the standard half-value thicknesses of these materials, and calculate the protection factor of the shelter you have just described. The Protection Factor (PF) number can then be found on row 26 of the spreadsheet, listed as #2 in column A.
![]()
What is the Protection Factor? According to FM 80-17, "The protection factor is simply the fraction of the available radiation dose which penetrates the shelter and reaches those inside compared to the radiation received by an unprotected person." Basically, it is a way of comparing two shelters equally, regardless of how they are constructed. A shelter with a PF of 5 is much less protective than a shelter with a PF of 200.
Further down on the spreadsheet (listed as #3), you will have an opportunity to change the exterior radiation level and the time interval. While I have provided defaults for each of these numbers which provide commonly used values, you may wish to see how a higher or lower radiation level would affect shelter occupants.
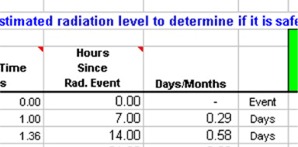
Under #4 on this tab are the results of a series of calculations to determine estimated radiation levels.
Columns C and D (Hours, Days) provide Hours, Days and Months since the nuclear detonation occurred.
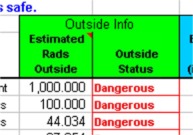
Columns F and G (Outside Info) provide the estimated radiation levels OUTSIDE in the open as well as the "status" or danger level to someone in that environment. (Note: The status information comes directly from the "Radiation Sickness" tab which will be discussed later.)
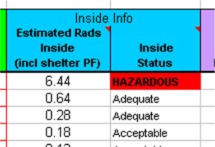
Columns H and I (Inside Info) provide the estimated radiation levels INSIDE the shelter you have described above, taking into account the protection factor (shielding material) of your shelter. The inside status information uses the same information from the "Radiation Sickness" tab, only using the lower estimated radiation levels inside your shelter. Keep in mind that these numbers are estimations and also assume that a person was inside the shelter when the attack occurred and has remained there, fully protected, during the entire time since detonation.
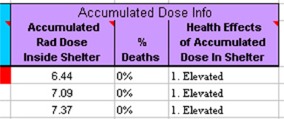
Columns J, K and L (Accumulated Dose Info) provide information on how much total radiation a person has received while INSIDE the shelter. Since the affects of radiation are cumulative, it is important to see hazardous trends before they develop. This should allow you some time to increase the protection level of your shelter before the danger fully develops. This spreadsheet allows you to "look into the future" a few days or weeks to see if the current protection factor of your shelter might still not provide enough to keep the occupants from accumulating too much radiation over a long period of time. This section also provides an estimate on the percentage of a normal, healthy population of adults which might be expected to die, giving a certain accumulated dose of radiation.
In cells, N41 through S52, you can also adjust the radiation levels at which you are willing to exit the shelter temporarily, work outside for longer periods, etc. and the estimation tables will change it's labeling accordingly.
2. Individual Logs tab
This is a summary page for up to five individuals. This page allows a shelter manager to quickly see the status of people under his charge, especially after people begin exiting for short periods of time. By clicking the "Update Occupant" buttons on the right, you can log in dosimeter readings for individuals and track their specific radiation dosages. The summary page will also help identify when someone needs to have a current reading.
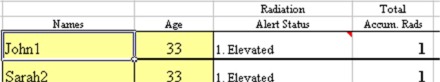
Information from the five individual occupant pages (mentioned below) rolls-up to this summary page. The only information captured on this summary page is Name and age.
3. Radiation Sickness tab
This page shows the radiation ranges, death rates and symptoms of people exposed to various levels of radiation. Other pages pull info from here. No data should be entered/changed here without an understanding that it will have a ripple effect across the rest of the spreadsheet.
4. Blast Overpressure tab
This page is for information only. It shows the effects of escalating PSI overpressures during a blast. Haven't used it in a calculation yet, but thought it appropriate to include it with the other info.
5. Configure tab
The "Configure" tab is used to allow the user to change how the spreadsheet operates. On this page, a user can change the half-value thicknesses of various materials (only the ones with blue backgrounds are currently used).
6. Avg Doses tab
This tab is also for information only. It includes a comparison of "normal" radiation doses, some EPA guidelines for maximum annual and lifetimes doses, etc. At the bottom of this page is also a brief explanation of the various radiation measuring units (Rad, Rem, Curie, etc), what they are for and how they are compared.
7. Radionuclides tab
This tab is also for information only. It is a list of all the radionuclides (radioactive elements) and their half-lives. Imagine some of this stuff scattered around your yard after a dirty bomb went off.
Tabs 8 through 12 - occup1, occup2, occup3, occup4, occup5
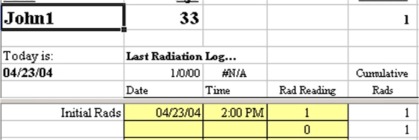
The next 5 tabs are used to track individual exposure of up to five individual shelter occupants. Right now it is limited to five. I can add more, but didn't want the spreadsheet to get too big. What I need here is a database, but wanted to keep the tool simple.
Conclusion
Again, this is a tool that I originally developed for myself and accept full responsibility for how it works. However, it is also a work in progress. Please let me know if you have any questions, comments or suggested improvements. Then pray we never have to use it.
Centurion
www.alpharubicon.com
All materials at this site not otherwise credited are Copyright © 1996 - 2004 Trip Williams. All rights reserved. May be reproduced for personal use only. Use of any material contained herein is subject to stated terms or written permission.